The Analytics plugin is used to visualize data about the pose detector's operation. This section describes its parameters and configuration procedure.
Tip
Before launching the dashboard, you need to install the Pose Detector 2.0.0 script. To obtain the script, please contact your account manager.
The process of installing and running scripts is described in the section Integrated script editor.
Setting up a dashboard consists of the following steps:
-
Open the Analytics plugin. To do this, click the Plugins button and select Analytics.

-
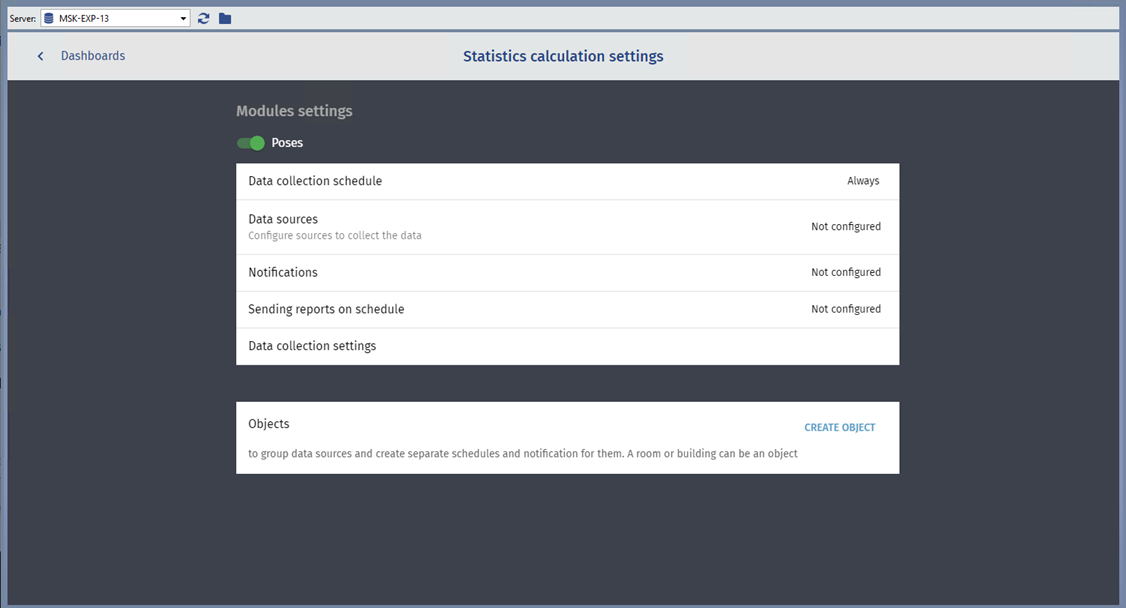
Enable Poses plugin.
-
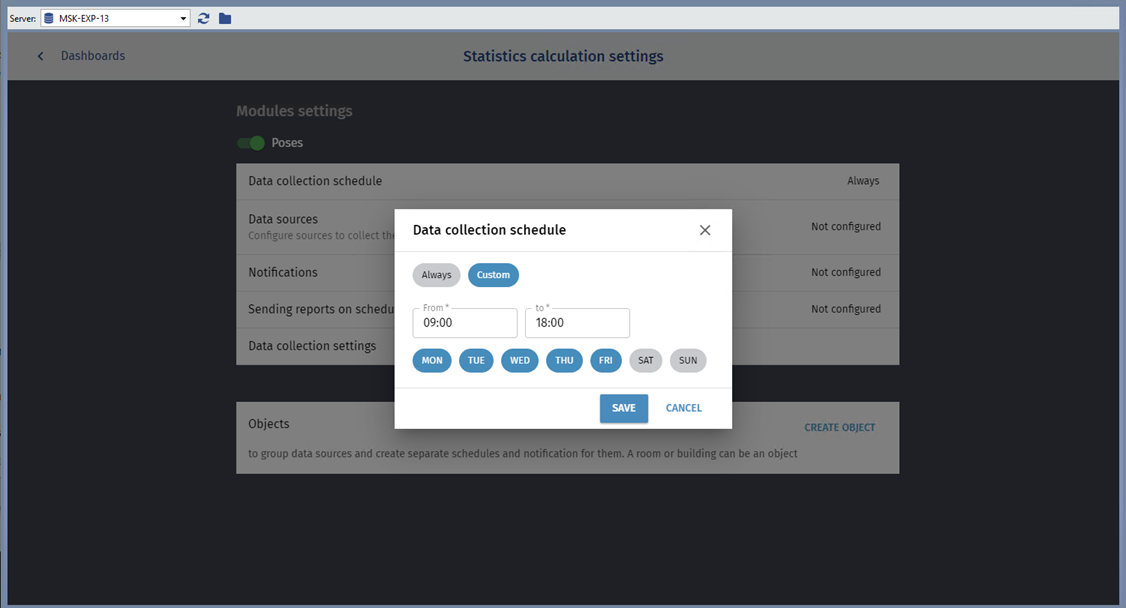
Set up a Data Collection Schedule.
-
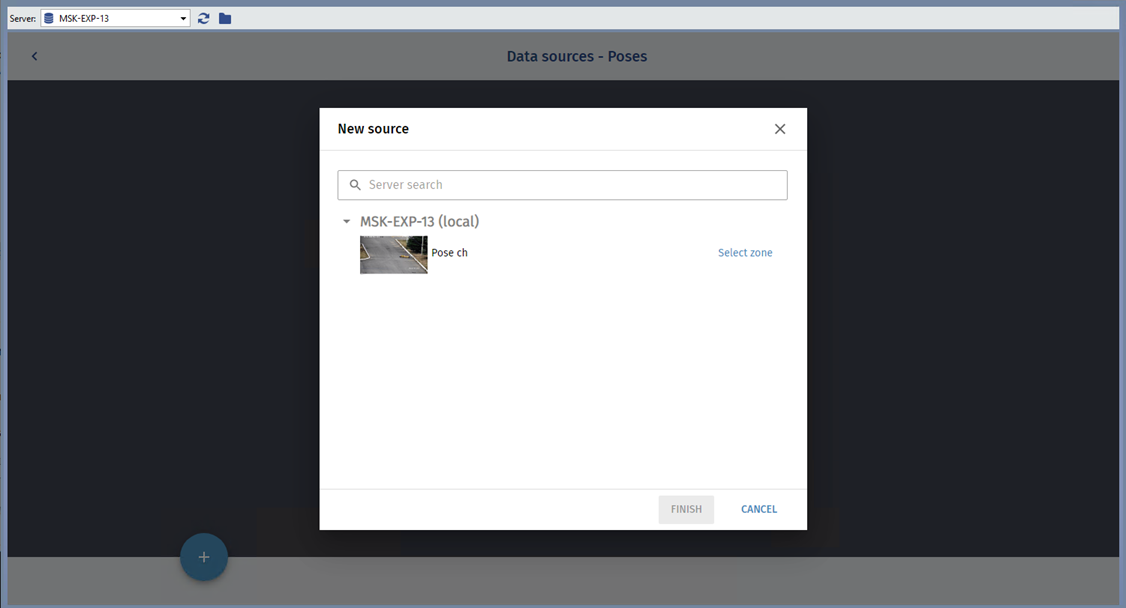
Create or select a Data source.
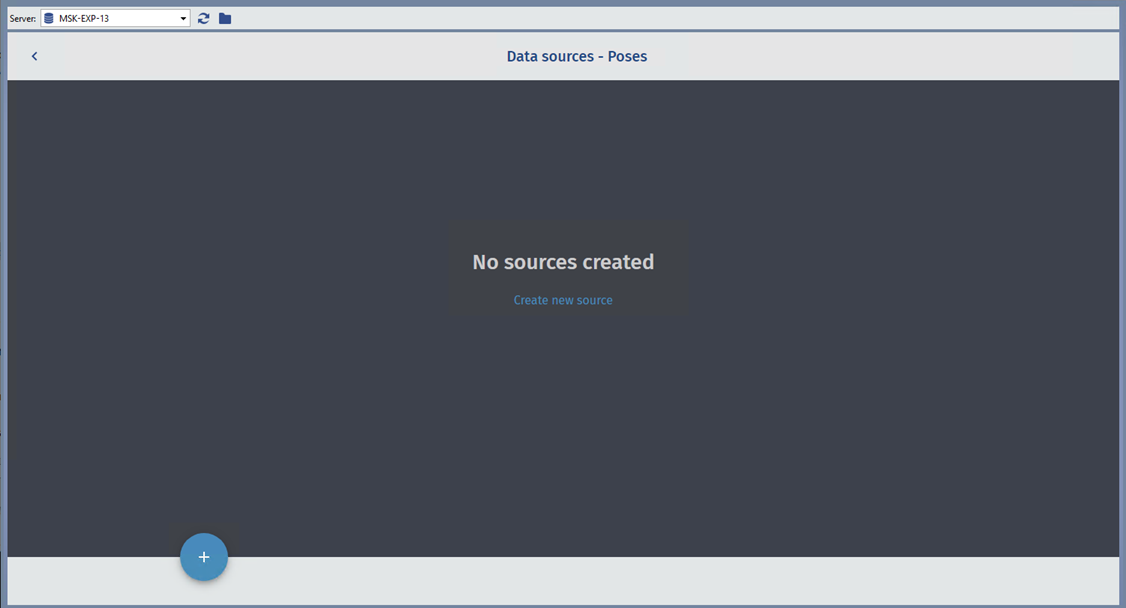
The data source for the pose detector are the Counting zones created on the channel (see Configure Pose Detector for a channel).
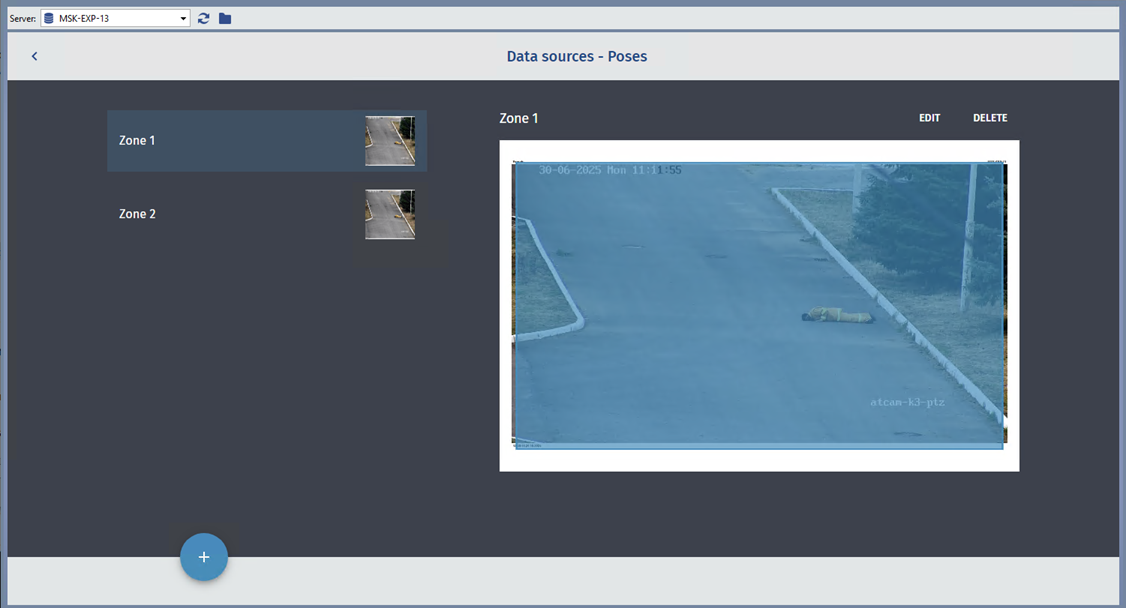
To create a new data source, click the Create new source link and select a zone.
If necessary, add the required number of zones to the data source.
-
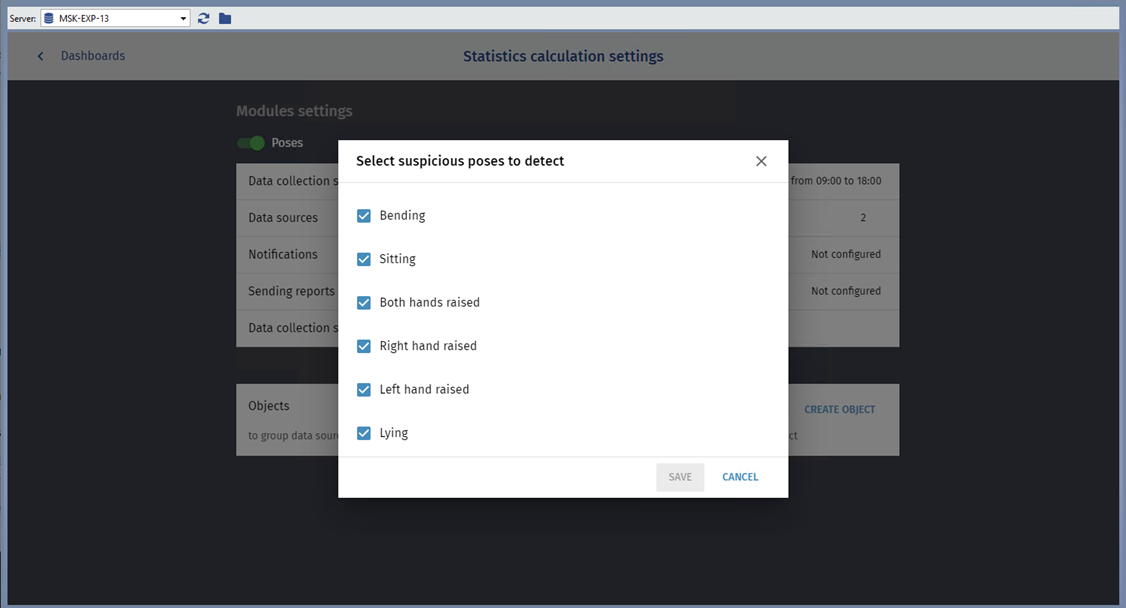
Select Data collection settings and specify the poses that the detector will consider suspicious and display on the dashboard.
Tip
To respond promptly, set up notifications in the Notifications section. This will allow you to receive real-time alerts about suspicious postures.
To analyze statistics, use the Sending reports on schedule option. This setting allows you to automatically generate and send reports on the pose detector's operation at specified times.
To display data on the dashboard, do the following:
-
Open the Dashboards section.
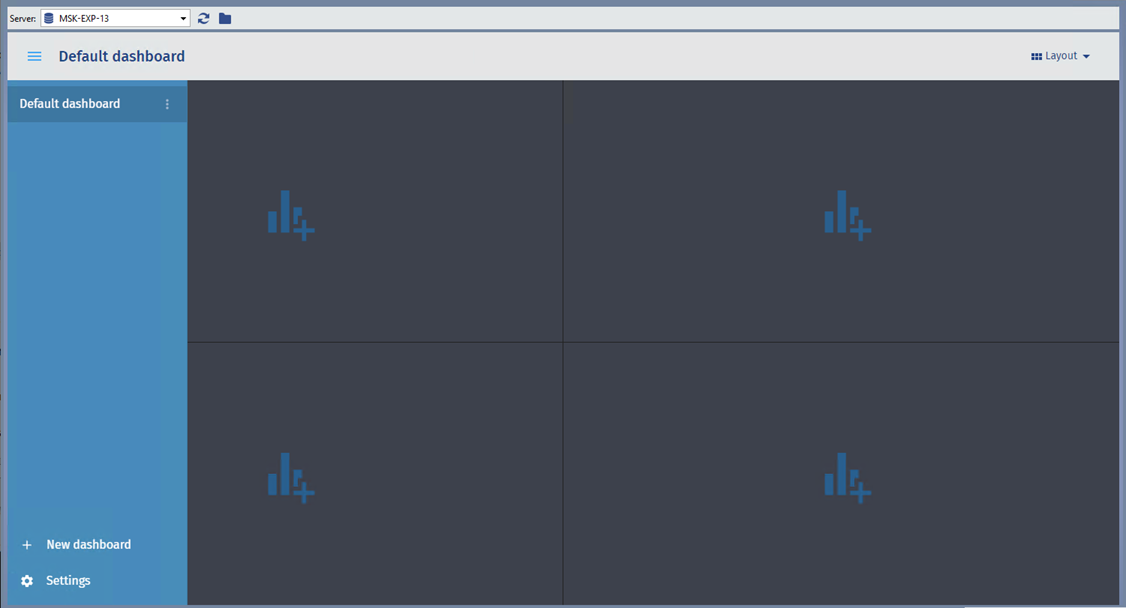
-
Click the cell where the chart will be displayed and select data sources.
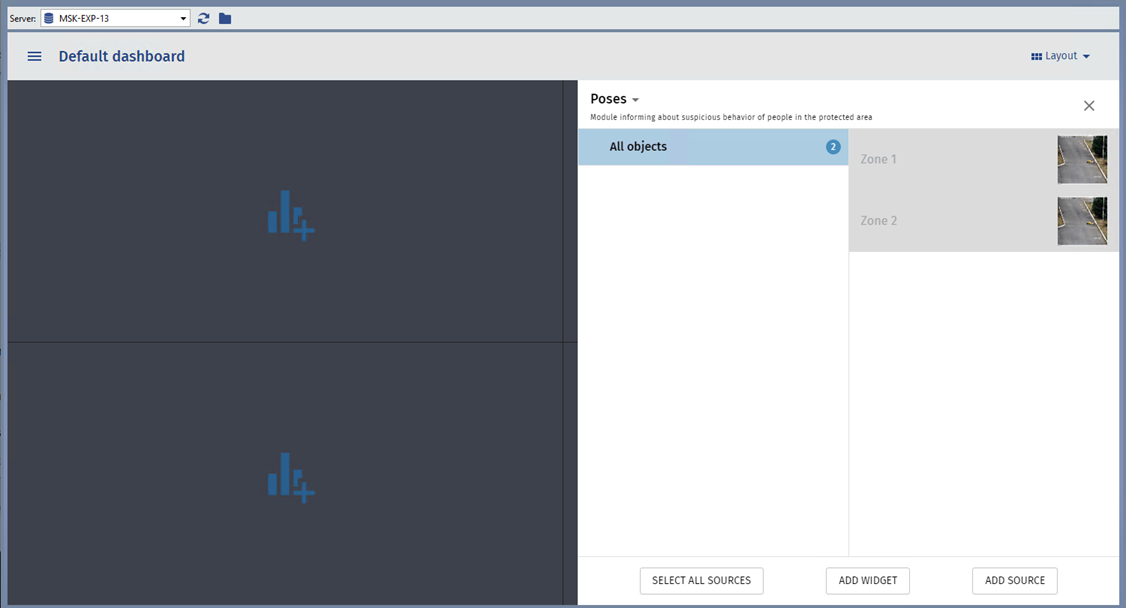
Click Add widget to continue.
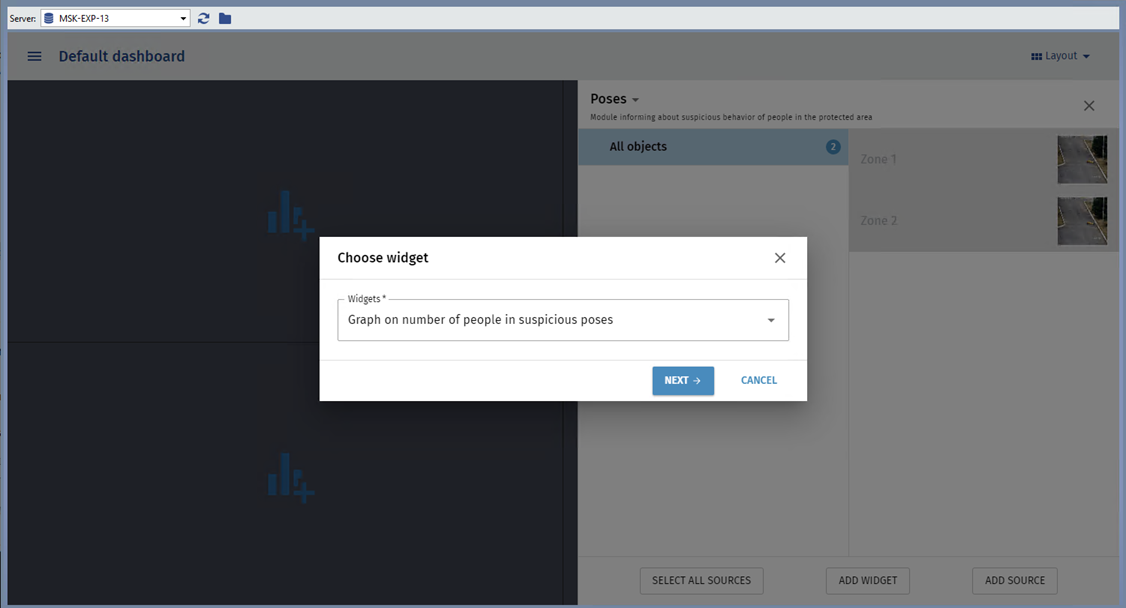
-
Select the widget type.
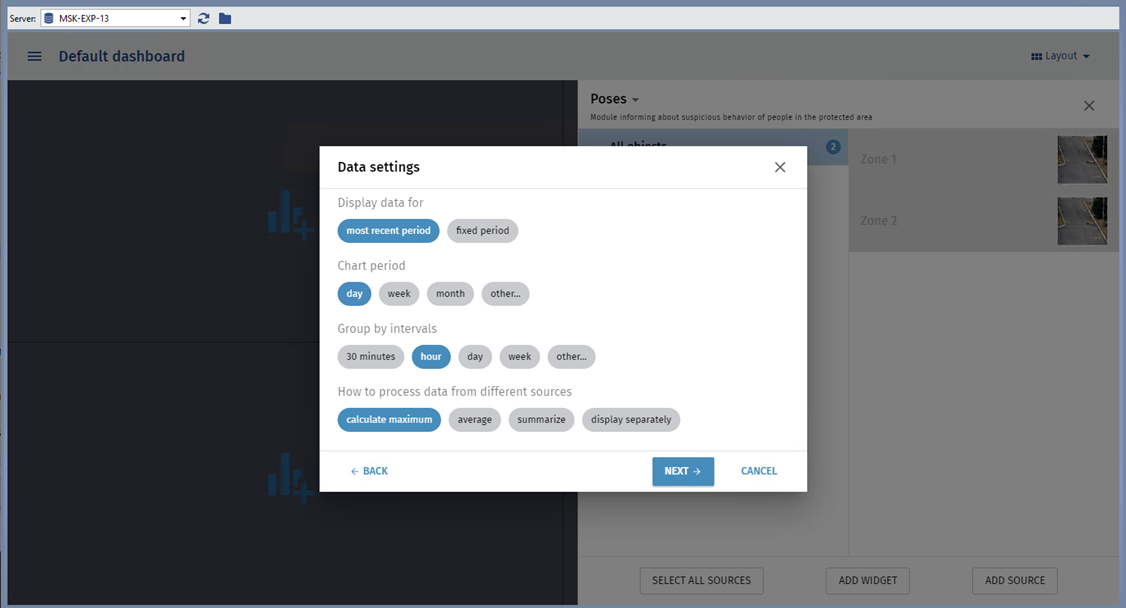
-
Configure the data presentation.
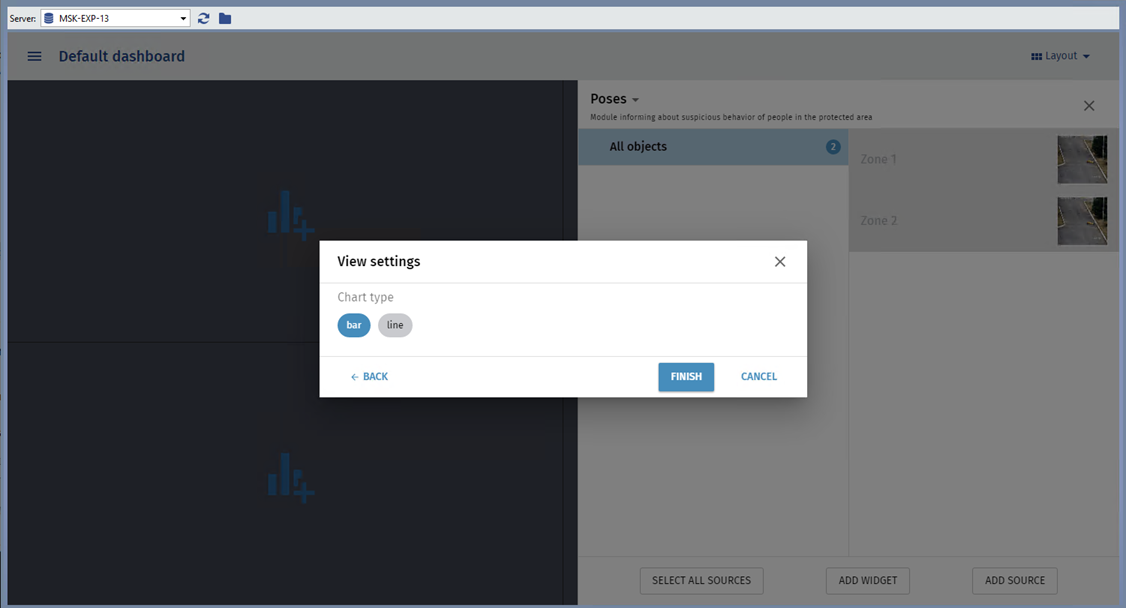
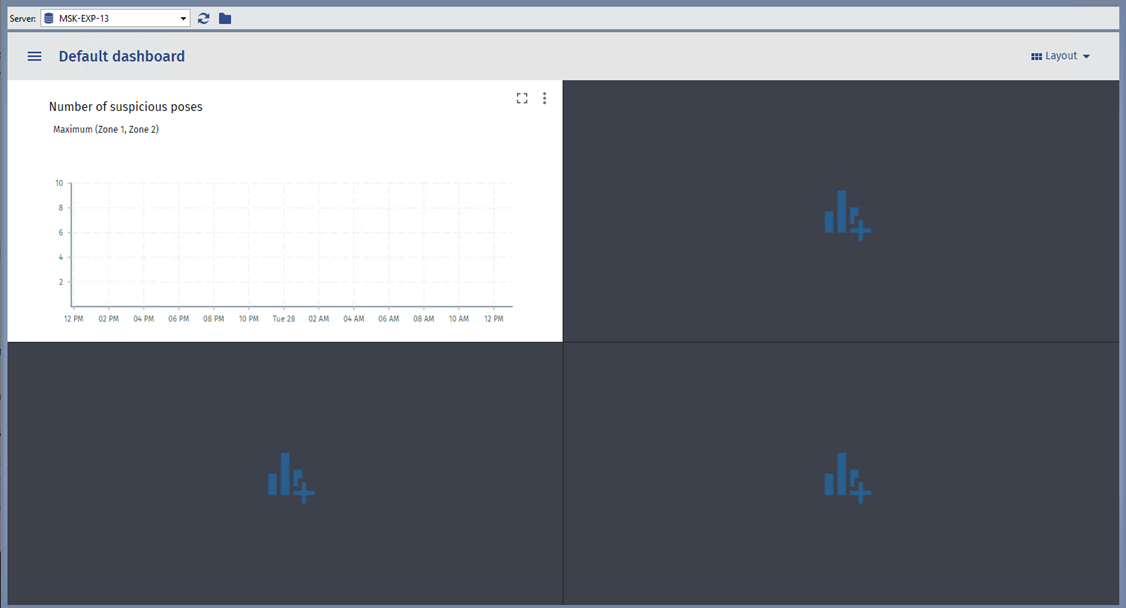
As a result, a graph will appear showing the number of suspicious poses detected by the detector.
Tip
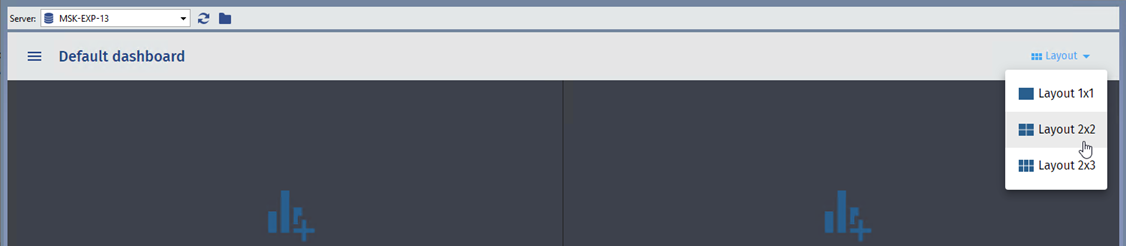
If necessary, you can change the layout of widgets on the dashboard.