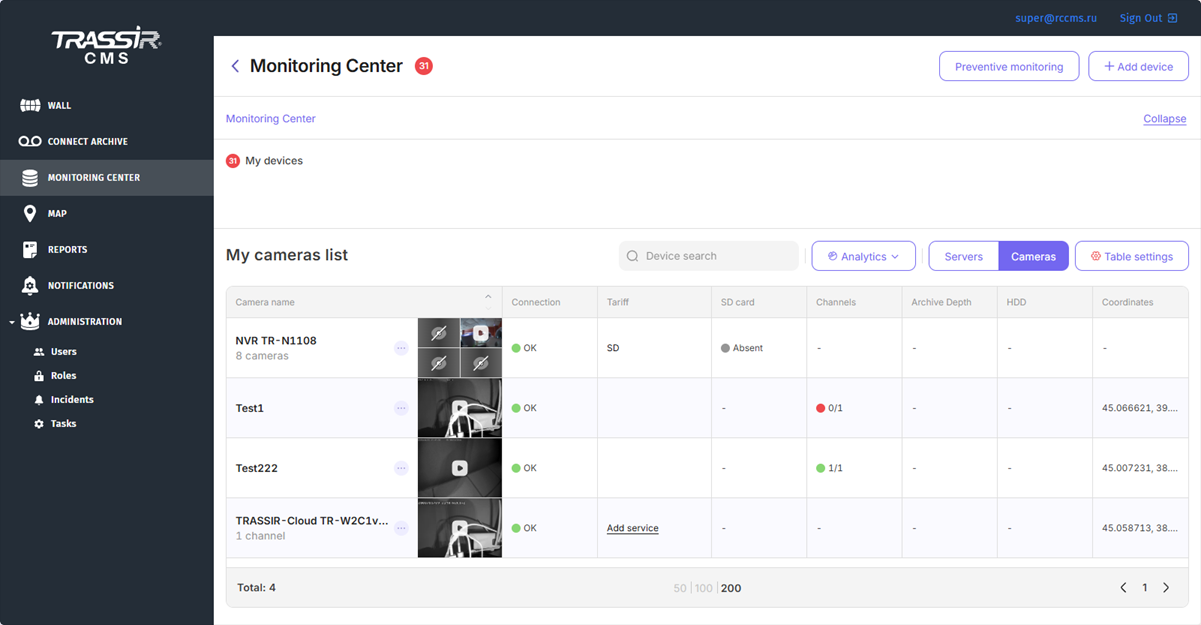
You can connect IP cameras, video recorders and servers to TRASSIR Central Management System. Monitoring Center tab contains the list of all connected devices.
All devices are divided into Servers and Cameras groups. You can create your own device subgroups in each group when working with numerous devices.

Next to the devices, there can be an icon with the following meaning:

Tip
The Add device button opens the window for the connection of a new device to TRASSIR CMS. For details, see Connecting devices.
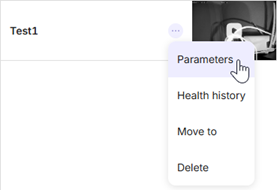
Press the button near the device name in the list to:
- Parameters - check and set up cloud device parameters.
- Archive settings in Trassir CMS - check and configure the archive parameters.
- Health history - open the status log of the device.
- Settings - open the camera settings page.
- Move to - move the device to a group.
- Delete - delete device.
Tip
The set of context menu items depends on the device type (camera or server) and the user rights in the assigned role. Read more about user rights in Roles.
The main function of TRASSIR CMS is monitoring of operational state of all connected devices. TRASSIR CMS monitors the following indicators of the device operation: state of cameras, HDD and data base, archive depth, uptime, software version, etc. In case an error occurs on one or several devices, a red indicator will appear near the My devices menu or the device group name. This indicator reports the number of devices operating with error.
Click the device to see the health indicators log.
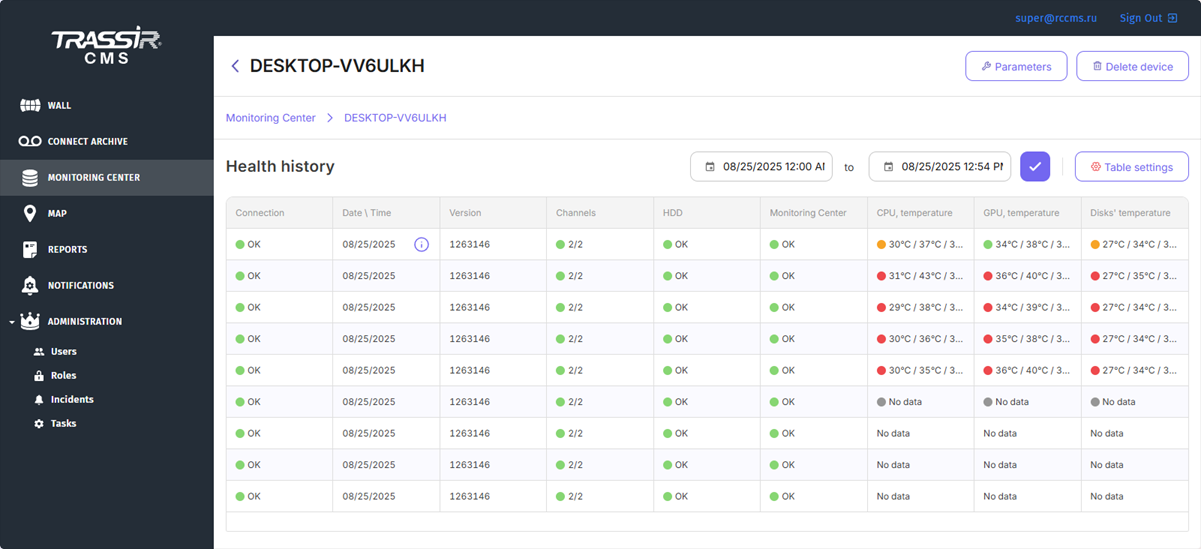
Not all health indicators are displayed in the table. To expand the list of the displayed indicators, press the Table settings button and check the boxes next to the required indicators. Drag the column name to the required position to adjust the display order of the columns.

Click a value in the Channels column to open a window with the detailed information about the server channels.

All servers with the latest version of TRASSIR software has the Monitoring Center function that collects and processes data on the device health using internal server services. All server health data is transmitted to TRASSIR CMS in the form of the following health indicators:
- for CPU: temperature, load and "loadover 90%" indicator;
- for Motherboard: temperature
- for RAM: load
- for GPU: temperature and load
- for HDD: number and writing speed, SMART indicators.
Tip
On Windows OS, Monitoring Center is launched as a standalone service. For details, see Starting the MC service on Windows.
All Monitoring Center indicators as well as other values can be displayed in the main device health table. The temperature and load will be displayed as three types of values: minimum, maximum and median.


